Welcome
to part 7 of BI with SharePoint and JavaScript. This is an ongoing
series about building dashboard reports in SharePoint with just a few
simple JavaScript frameworks and a Content Editor Web Part.
Here are the articles in the series.
- Simple online column chart (Demo)
- Combination charts: Stacked bar chart with line. (Demo)
- Using tabs to build a dashboard and printing reports. (Demo)
- Visualization: Packing a lot of data into a simple chart to yield maximum benefits (Demo)
- Slice and Dice data while using a page from social media to build intelligence into your reports. (Demo)
- Analytics - What If Analysis.(Demo)
- Tips for extracting, transforming and loading data for online reports.
This post was supposed to be a set of tips detailing the things I learnt about loading data into SharePoint from other sources using MS-Access as a bridge. However, I came across a tool called Omniscope
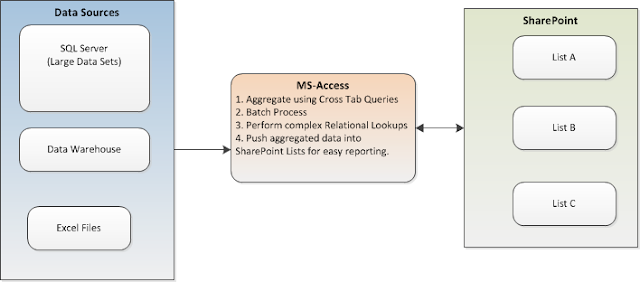
which changed the game of ETL and reporting in the last few months for me. The following two diagrams explain the different approaches.
Approach I
Use MS-Access as a bridge between the external data and SharePoint. Use cross tab queries, lookup tables , and VBA macros to push/update data in SharePoint for reporting. 
Approach II

